
Fieldwork was undertaken between January 11th and March 20th 1999. The summaries of the daily data records for this period are detailed in the appendices. The relocation of devices was undertaken over a continuos period of time on each field trial excursion. Consequently, wind speed and sea state on many trialing days fluctuated markedly. In order to conduct a comprehensive matrix of relocations under comparable conditions, it is preferable for the prevailing environmental conditions to remain constant. Although the fieldwork was conducted over a two-month period, the trialing conditions did not frequently provide protracted periods of stable conditions. Inevitably, not all devices have been trialed under the full range of conditions. This was particularly the case with light intensity.
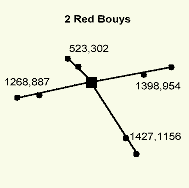
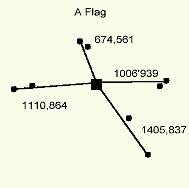
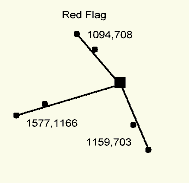
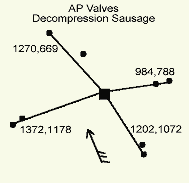
Deployment method A was used on four days and proved useful in providing initial relocation distances. The first device to be sighted on any approach drew the observer's attention immediately towards adjacent devices, thus giving a false impression of the relocation distances of other devices. Additionally they do not simulate the relocation of devices under real search conditions. The random deployments conducted on four days produced a more diverse range of relocations. In some instances, observers would unknowingly mark an approximate deployment position upon relocation of a device if a prominent landmark formed an obvious transit to it. These position fixes proved to be of little assistance however when additional relocations were undertaken on reciprocal headings or other tangents to the same device. Deployment method C was used on twelve occasions and provided the largest number of relocations. Though observers witnessed the deployment of devices whilst using this method, relocations proved difficult in many instances. The search vessels used a variety of headings and observers could not readily estimate deployment positions due to the open expanse of the deployment area. Method D was used on the last two days of trialing. These relocation distances allow more direct comparisons between devices as relocation headings were standardised for each device. The deployment and relocation of devices were plotted for most trial days and correlated with search aspect and wind direction. Figure 1 shows a typical example of these plots. These plots were used to ascertain any differences in relocation distances with change in search aspect.
A wide range of environmental conditions was experienced during the course of the research. Sea states ranged from calm to rough, with waves occasionally higher than 1.5 m. Cloud cover ranged from clear to overcast, with overcast predominating. Visibility ranged from less than 2 nm to more than 10 nm, though typically this was between 6 and 10 nm. During the period of the field trials, relocations were conducted between 10:00 hours and 19:00 hours with the typical daylight hours changing with increasing day length. Devices were relocated under a rage of light intensities from 1.4 to 175,000 lux. Daytime light intensities typically ranged from 5,500 to 175,000 lux. Light intensities of less than 175 lux typically represent failing light towards darkness. An intermediate light intensity is covered between 175-4,500 lux, and intensities greater than 4,500 lux were typical of dull, overcast days through to clear and bright days. As a guide to the dynamic range of light intensity, a bright sunny day may be 100,000 lux, office lights, 1000 lux; and a full moon 0.1 lux . The period of time for falling light intensities following normal daylight hours was relatively short during the trial period. Light intensities during the afternoon of 19th January are clearly demonstrated in Table 2.
Table 2 Light intensity with time, 19th January 1999
|
Time (GMT)
|
Light Intensity (lux)
|
|
14:40
|
88,000
|
|
16:10
|
5,500
|
|
16:20
|
2,800
|
|
16:25
|
1,400
|
|
16:55
|
1.4
|
 |
 |
 |
 |
The two values reresent the first and the last observer to relocate the device.
Distances in meters
Conditions
Date: 10th March 1999
Windspeed: 12-25mph
Wind direction: SSE
Wave height: 0.5-0.7m
Broken cloud with sunny spells
Light intensity:88,000lux
Visibility:10 miles plus
The range of sea states experienced during the course of the research ranged from less than 0.5 to 2.0 metres. Sea waves in excess of 1.5 m were experienced only on brief occasions. Whilst wave height increased with wind speed there was often a delay in the period of time required to manifest the corresponding wave height. Similarly, this delay was also experienced with decreasing wind speeds. It is therefore not possible to classify broad divisions of sea sate with any given range of wind speed in the first instance. For the purposes of summarising data, relocation distances were collated and grouped into wave height classes of less than 0.5 m, 0.5 to 0.9 m and greater than or equal to 1.0 m.
Data was also grouped into three broad divisions of light intensity. These were selected at less than 175 lux, 175 to 4,500 lux and greater than 4,500 lux. These divisions approximate to darkness, intermediate and daylight. Relocation distances of each device falling into the appropriate matrix of wave height, light intensity and observation platform, were extracted from all the daily data records, collated and averaged. These summaries are detailed in tables 3 to 17 and represent a total of 481 individual relocations.
Tables 3 to 17 Collated relocation distances (meters) of devices from (a) hard boat and (b) inflatable
Yellow Flag
|
|
||||||||||||||||||||||||||||||||||||||||||||||||
Orange / Red Flag
|
|
||||||||||||||||||||||||||||||||||||||||||||||||
A Flag
|
|
||||||||||||||||||||||||||||||||||||||||||||||||
Black Flag
|
| ||||||||||||||||||||||||||||||||||||||||||